
Economic Surprise Index (ESI)
The ESI measures whether major-economy economic data releases are beating or missing consensus forecasts, aggregated over a 90-day rolling window. It uses a decay-weighted z-score methodology modeled on the Citigroup CESI and Bloomberg BEEI — the same approach used by institutional macro desks to gauge whether a currency's economic backdrop is improving or deteriorating relative to market expectations.
What Is the Economic Surprise Index
The Economic Surprise Index (ESI) answers a specific question: are economic data releases for a given currency consistently beating market forecasts, missing them, or landing in line? It does not measure whether the economy is strong or weak in absolute terms — it measures whether it is stronger or weaker than expected.
This distinction matters because FX markets price in expectations. A currency that trades at a given level already reflects the market's best estimate of future economic conditions. What moves it further is new information — data that surprises relative to those expectations. The ESI tracks whether those surprises have been running systematically positive (beats) or negative (misses) across all major-economy medium and high-impact releases.
| Index value | What it means | Typical FX implication |
|---|---|---|
| Strong positive (above +40) | Recent data has systematically beaten forecasts by a wide margin | Supportive — macro backdrop stronger than priced; rate cut expectations may fade |
| Mildly positive (+10 to +40) | More beats than misses, moderate magnitude | Broadly supportive — modest upside pressure; reinforces existing trend |
| Neutral (-10 to +10) | Beats and misses roughly balanced | No signal — data not providing a directional impulse |
| Mildly negative (-40 to -10) | More misses than beats, moderate magnitude | Broadly negative — macro underperforming; adds pressure to existing weakness |
| Strong negative (below -40) | Recent data has systematically missed forecasts by a wide margin | Negative — deterioration vs expectations; increases probability of rate cuts |
Why Surprises Drive FX Direction
Central bank rate decisions — the primary driver of medium-term FX direction — are made in response to incoming economic data. When data consistently beats expectations, it reduces the probability of rate cuts and increases the probability of rate hikes, both of which attract capital inflows and strengthen the currency. When data consistently misses, the opposite occurs.
The ESI captures this dynamic before it shows up in OIS pricing or CB meeting decisions, because the OIS market takes time to reprice and CB decisions are infrequent. A currency's ESI turning positive several weeks before the next meeting is an early signal that the next meeting's language may be less dovish than the market expects — or that a priced-in cut may be pushed back.
The ESI also reflects the relationship between market consensus and reality. As data consistently beats, analysts revise their forecasts upward — eventually the bar becomes harder to clear and the ESI naturally mean-reverts. This mean-reversion behavior (well-documented in the Citigroup CESI) makes the ESI a cyclical signal rather than a persistent one.
Methodology Overview
The terminal's ESI scoring methodology follows the Citigroup CESI and Bloomberg BEEI conventions as closely as the available data permits. The key steps:
- Event filter: Only major-economy medium and high-impact releases with both a consensus forecast and an actual result are scored. Low-impact events and data without a forecast baseline are excluded. Noise events (bond auctions, rig counts, inventory data — see the Excluded Events section) are filtered out regardless of their impact rating.
- Deduplication: Flash and Final PMI prints are deduplicated so each macro signal is counted only once, even when published on different dates with the same data. The dedup key is based on the canonical event name plus the actual value.
- Beat/miss classification: For each event, actual is compared to consensus forecast. If actual > forecast, it is a beat. If actual < forecast, it is a miss. For inverse indicators (e.g. unemployment rate, jobless claims), the sign is flipped so that a lower actual than forecast correctly scores as a beat.
- Decay weighting: Each event's contribution is multiplied by an exponential decay weight based on its age. Recent events carry more weight; older events fade. Half-life is 45 days — matching the Citi CESI convention.
- Z-score normalization: When an event has at least 5 historical observations on file, the magnitude of the surprise is normalized using the historical mean and standard deviation. This gives more weight to statistically significant surprises and less to routine noise. Events without sufficient history use a simpler beat/miss score.
- Index normalization: The final index is scaled to the range [−100, +100], matching the visual convention of the Citi CESI. The zero line is centered; green bars extend right for positive values, red bars extend left for negative values.
- Confidence weighting: The [-100, +100] index is then scaled by a confidence factor equal to the currency's event count (the same N shown in the panel) divided by 15, capped at 1.0. A currency with fewer than 15 qualifying releases therefore shows a proportionally muted index rather than the full-magnitude reading — a single beat or miss can no longer, on its own, produce a bar as large as one built from a full quarter of releases. This applies uniformly to every currency; for G7 currencies N is almost always well above 15 within the 90-day window, so the factor is 1.0 in practice and this step has no visible effect for them.
- Adaptive window for sparse currencies: The standard scoring window is 90 days for every G10 currency. If a currency ends that pass with zero scored events — in practice this only happens for NOK and SEK, whose upstream provider tags nearly all their releases as low-impact — the window widens to a 90–180 day band for that currency only, using the identical impact filter and decay function. Widening the window never lowers the bar: an event at 150 days old still carries only ~13% of its original weight under the 45-day half-life, so it provides a non-zero baseline rather than materially changing the signal. Even after widening, NOK and SEK typically stay below the N=15 confidence threshold above, so their index readings are usually shown at reduced magnitude rather than full strength.
Time Decay — Why Recent Data Matters More
Institutional CESI indices apply exponential time decay to prevent stale data from distorting the current picture. A CPI print from 85 days ago reflects conditions that are no longer relevant to current rate expectations — but without decay, it would weigh equally with last week's print.
The terminal uses a 45-day half-life, matching the Citigroup CESI convention:
| Event age | Decay weight | Interpretation |
|---|---|---|
| 0 days (today) | 1.00 | Full weight — most recent release |
| 22 days | 0.71 | Approximately 3 weeks ago |
| 45 days | 0.50 | Half-life — carries half the weight of a current event |
| 67 days | 0.36 | Two months ago — diminishing influence |
| 90 days | 0.25 | At the edge of the 90-day window — minimal weight |
The N column in the panel still shows the raw event count (not decay-adjusted) for transparency — so you can see how many events contributed to the score, regardless of their age-weighted influence.
Z-Score Scoring — Magnitude, Not Just Direction
A simple beat/miss score treats a CPI print that beats by 0.1pp the same as one that beats by 0.5pp. Institutional indices correct for this by normalizing the surprise magnitude using the historical distribution of surprises for that specific release.
The z-score formula is:
z = (actual − forecast − historical_mean) / historical_std
Where historical_mean and historical_std are computed from all prior instances of the same release on file. A minimum of 5 historical observations is required before z-score is used — below that threshold, the simpler beat/miss score is applied.
When z-score scoring is available for a subset of events and beat/miss for the rest, both are combined proportionally, maintaining consistent decay weighting throughout. The ESI index value displayed maps a ±2-sigma z-score to approximately ±100 on the index scale.
Inverse Indicators
For most economic releases, a higher actual than forecast is a positive surprise — better-than-expected GDP growth, higher-than-expected PMI, stronger-than-expected employment. But some indicators are inverse: a lower actual is the positive economic signal.
The terminal applies the sign inversion to the following indicator categories:
| Indicator type | Beat condition | Reasoning |
|---|---|---|
| Unemployment rate | Actual < forecast | Fewer unemployed than expected is a positive outcome |
| Jobless claims | Actual < forecast | Fewer new unemployment filings than forecast signals labour market strength |
| Budget deficit | Actual < forecast (less negative) | A smaller fiscal shortfall than expected reduces sovereign risk premium |
This inversion ensures that a positive z-score always indicates a positive economic surprise regardless of which direction "positive" runs for a given indicator — matching the convention used by the Citi and Bloomberg indices.
actual > forecast, which scores correctly as a beat with no sign flip required.
Excluded Events
Institutional ESI indices only score fundamental macro releases — the events that directly inform central bank rate decisions. The terminal filters out the following categories, which either lack a meaningful consensus forecast or are not relevant to the macro cycle:
- Energy and commodity data: Baker Hughes rig count, API and EIA crude oil inventories, EIA natural gas storage, crude imports, distillate and gasoline data. These are supply-side logistics releases, not macro indicators.
- Bond and bill auctions: US Treasury auctions (4-week, 13-week, 52-week bills, 10-year note, 30-year bond), gilt auctions (UK), JGB auctions (Japan), and equivalent. Auction bid-cover ratios are financial market events, not economic data releases.
- Positioning and financial flow data: CFTC speculative net positions, TIC capital flow data (net long-term, total net), and foreign investment in Japan flows.
- Money supply: M2, M3, and M4 money supply releases for all currencies. These are coincident or lagging indicators with weak forecast consensus.
- Derived nowcasts: Atlanta Fed GDPNow, NY Fed Nowcast, Cleveland Fed CPI estimate. These are real-time model estimates, not official statistical releases.
- SEP and forward guidance data: Fed dot plot interest rate projections and equivalent forward guidance publications.
- Sentiment surveys without consensus: IBD/TIPP Economic Optimism and similar surveys that lack a reliable Bloomberg consensus baseline.
Reading the ESI Panel
The Economic Surprises panel in the terminal displays one row per G10 currency. Each row contains:
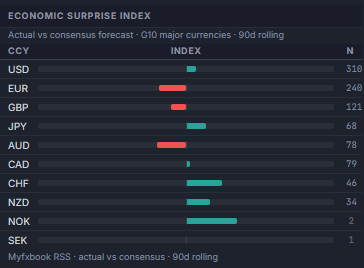
| Column | What it shows | How to read it |
|---|---|---|
| Currency | major currency code (USD, EUR, GBP, JPY, AUD, CAD, CHF, NZD, NOK, SEK) | Click any row to open the detail modal with the full event breakdown for that currency |
| Bar chart | Centred bar extending right (green, positive) or left (red, negative) | The zero line is at centre. Bar width represents the index value (max ±100). Green = more beats than misses; red = more misses than beats |
| N | Raw count of scored events with actuals in the scoring window (90 days, or 90–180 days if widened) | Dimmed N indicates low confidence (below 15 events) — the index/bar itself is also scaled down proportionally by N/15 in that case, not just the text color. For NOK/SEK, the row tooltip flags when the window was widened to 180 days due to sparse 90-day coverage. Higher N = more statistically robust index |
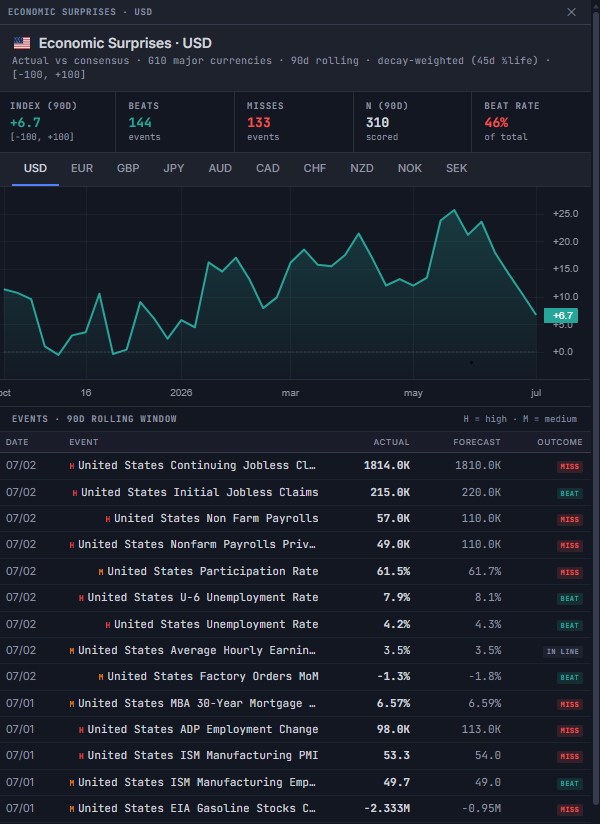
Hovering over any row shows the full tooltip: beats, misses, in-line count, beat rate percentage, raw index value, and decay method.
Clicking a row opens the detail modal with the individual event log — each release listed with its date, actual vs forecast, beat/miss result, and decay-adjusted weight. This is the full audit trail behind the aggregate index value.
ESI Divergence as an FX Signal
The most actionable use of the ESI is comparing two currencies simultaneously — specifically, looking for cases where one currency's index is rising while the other's is falling. This divergence is more reliably directional for FX than either index reading in isolation.
The reason: FX pairs are relative instruments. EUR/USD is not just about EUR fundamentals — it is the relative strength of EUR versus USD fundamentals. An ESI that shows both USD and EUR deteriorating tells you very little about EUR/USD direction. But an ESI where USD is rising and EUR is falling provides a clear relative signal.
| Scenario | Example | FX implication |
|---|---|---|
| Currency A rising, Currency B falling | USD ESI +35 and rising; EUR ESI -20 and falling | Bearish EUR/USD — macro divergence widening in USD's favor |
| Currency A flat, Currency B strongly positive | GBP ESI +5; AUD ESI +55 | Bearish GBP/AUD — AUD macro outperforming |
| Both currencies recovering from negative | USD ESI -30 → -10; EUR ESI -40 → -30 | Unclear — USD recovering faster is mildly bullish USD/EUR, but both are still negative |
| Both currencies strongly positive | CAD ESI +60; NZD ESI +55 | Neutral — both overperforming; pair direction driven by other factors (COT, rate differential) |
Limitations and Context
The ESI is a useful component of a multi-factor analysis framework, but it has specific limitations that are important to understand:
- It is a lagging indicator of sentiment, not a leading indicator of price. The ESI reflects what has happened in data releases over the past 90 days. It does not predict where data will go next. A high ESI can remain high for several more weeks before deteriorating, or it can reverse immediately — the index does not signal which.
- Mean-reversion tendency. As documented in academic studies of the Citigroup CESI, economic surprise indices tend to mean-revert because analyst forecasts adjust to systematic beats or misses over time. An ESI that has been persistently positive for 10+ weeks is statistically more likely to weaken than to continue rising — not because the economy is deteriorating, but because forecasters have raised their expectations.
- Consensus quality varies by currency. The Bloomberg consensus for USD economic releases is deep and liquid — dozens of contributing analysts producing well-calibrated forecasts. For some smaller G10 currencies (NZD, CHF, NOK, SEK), the consensus is thinner and individual outlier estimates can produce false beats or misses. A lower N value no longer just flags caution visually — it directly discounts the index magnitude (scaled by min(1, N/15)), so a currency with a handful of releases can no longer display the same full-strength bar as one with dozens.
- The ESI does not capture market impact directly. Not all beats or misses have equal FX impact. A surprise in a release the market currently considers a key policy variable (e.g. US CPI during an inflation-sensitive Fed cycle) has far greater FX impact than an equivalent surprise in a secondary release. The z-score methodology partially addresses this by weighting larger surprises more, but it does not specifically amplify releases that are contextually more important to the current rate-setting narrative.
For this reason, the ESI is most effective when read alongside the CB Rate Expectations panel (which shows what OIS markets are pricing for the next CB meeting), the COT Positioning panel (which shows institutional medium-term directional bias), and the Cross-Asset Risk regime (which determines whether carry trades are being rewarded or unwound).
Current Economic Surprise Index for all G10 currencies — beat/miss breakdown, event detail modal, and comparison against COT positioning and rate expectations. Available on the web terminal and natively inside MetaTrader 5 through the companion Expert Advisor — both unlock under a single EA rental on MQL5 Market.