GBP/JPY Bias Factors: What Drives and Changes the Directional Bias
GBP/JPY directional bias is determined by five factors: GBP COT positioning (CFTC Leveraged Funds net contracts), JPY COT positioning (net short JPY is bullish GBP/JPY), the BoE vs BoJ rate differential trend, the cross-asset risk regime, and retail FX positioning as a contrarian confirmation signal. This guide explains each factor, what a bullish or bearish reading looks like, and the five specific catalysts most likely to change the current bias — with links to the live data panels in the terminal where each factor is tracked.
GBP/JPY Bias Factors — Quick Reference
The five factors that determine GBP/JPY directional bias, and the specific conditions that constitute a bullish or bearish reading for each:
| Factor | Bullish signal | Bearish signal |
|---|---|---|
| GBP COT (CFTC) | Net long GBP, positive WoW delta, green LF/AM dot | Net short GBP, negative WoW delta, split or red dot |
| JPY COT (CFTC, read directly) | Net short JPY (negative contracts) — bearish JPY = bullish GBP/JPY | Net long JPY (positive contracts) — bullish JPY = bearish GBP/JPY |
| BoE vs BoJ differential | BoE hold/hike + BoJ hold/cut; stable or widening spread | BoJ hike expected; BoE cutting while BoJ holds |
| Cross-asset risk regime | RISK-ON (VIX below 18); carry trades rewarded | RISK-OFF (VIX above 30); JPY short liquidation overrides all factors |
| Retail FX positioning | Retail heavily short (<30% long) — contrarian confirmation | Retail heavily long (>70% long) — contrarian warning |
Why GBP/JPY Is Structurally Different
GBP/JPY does not have a direct futures contract on the CME. It is a cross rate derived from GBP/USD and USD/JPY. As a result, understanding its medium-term directional bias requires reading two separate COT reports — one for GBP futures (6B on the CME) and one for JPY futures (6J on the CME) — and then synthesizing them.
This is what makes GBP/JPY unique: you are simultaneously watching institutional positioning in a higher-yielding currency (GBP) and a traditional safe-haven / carry-funding currency (JPY). When both signals align — institutions net long GBP and net short JPY — the bias is unambiguous. When they diverge, caution is warranted.
The pair also carries an unusually strong sensitivity to global risk appetite. The JPY leg functions as a risk barometer: when equity markets sell off sharply (VIX spike, risk-off regime), institutions unwind JPY shorts at speed regardless of the GBP leg's fundamentals. This means a well-constructed GBP bullish thesis can be overridden in hours by a macro shock that has nothing to do with UK data.
GBP COT Positioning
The GBP futures (6B) COT data in the terminal's CFTC Positioning panel shows the net position of Leveraged Funds — the speculative category that most closely mirrors directional institutional bias. The columns to focus on for GBP/JPY analysis:
| Column | What it tells you for GBP/JPY |
|---|---|
| Net contracts | Absolute long or short bias of institutional speculators. Positive = net long GBP = bullish GBP leg of GBP/JPY. Negative = net short GBP = bearish GBP leg. |
| Long% | Percentage of total GBP positions that are long. Above 60% = majority bullish. Below 40% = majority bearish. Extremes above 75% or below 25% historically precede reversals. |
| WoW Δ (week-over-week change) | Direction of change matters as much as the absolute level. An increasing net long position with a rising WoW Δ confirms momentum. A flat or shrinking WoW Δ at an extreme signals position saturation. |
| Net%OI | Net position as a percentage of total open interest — the standard institutional normalization for COT data. Values above +15% indicate strong directional conviction; above +25% signal potential crowding. |
| LF/AM dot | Alignment between Leveraged Funds and Asset Managers. Green dot = both net long GBP = highest-conviction bullish signal. Split alignment = weaker, less reliable signal. |
→ See current GBP COT net position in the CFTC Positioning panel
JPY COT Positioning
JPY futures (6J) are quoted as USD per JPY — so a net long position in JPY futures means institutions are bullish JPY, which is bearish for GBP/JPY. Confusing this with a GBP-style "long = bullish for the pair" reading is the single most common error in reading GBP/JPY COT data.
The correct interpretation matrix:
| JPY COT net position | Meaning for JPY | Implied GBP/JPY bias |
|---|---|---|
| Large net short JPY | Institutions bearish JPY — expecting JPY weakness | Bullish GBP/JPY — weaker JPY pushes pair higher |
| Neutral / flat JPY | No strong institutional JPY view | Neutral — GBP/JPY direction driven by GBP leg |
| Large net long JPY | Institutions bullish JPY — expecting JPY strength | Bearish GBP/JPY — stronger JPY pushes pair lower |
The JPY COT position also carries a risk-regime dimension. Historically, the largest short JPY positions (peak crowding) are built up during sustained low-volatility, risk-on environments. When VIX spikes above 25, these positions are liquidated rapidly — producing sharp, fast GBP/JPY drops that are disproportionate to UK fundamentals. The Net%OI column is especially important for JPY: when Net%OI is below -20% (heavily net short), GBP/JPY is particularly vulnerable to a reversal triggered by any risk-off shock.
→ See current JPY COT net position and Net%OI in the CFTC Positioning panel
BoE vs BoJ Rate Differential
The interest rate differential between the Bank of England and the Bank of Japan is the foundational structural driver of GBP/JPY. A wide positive differential (BoE rate significantly above BoJ rate) incentivizes carry trades — borrowing JPY at low cost to hold GBP-denominated assets — which creates sustained structural demand for GBP/JPY.
The terminal's CB Rates panel shows both the current policy rates and the trend arrow (hiking / cutting / on hold) for BoE and BoJ. The CB Rate Expectations panel shows the market-implied forward bias derived from OIS pricing — what the market expects at the next meeting for each bank.
The relevant combinations for GBP/JPY:
| BoE bias | BoJ bias | Structural implication for GBP/JPY |
|---|---|---|
| Hold / Hike | Hold / Cut | Bullish — differential stable or widening; carry trade supported |
| Hold | Hike | Bearish — differential narrowing; carry unwind pressure. BoJ hikes historically trigger the sharpest GBP/JPY drops. |
| Cut | Hold / Hike | Bearish — both legs compress the differential simultaneously |
| Cut | Cut | Neutral — differential direction depends on relative pace; watch OIS pricing for each |
→ See current BoE and BoJ rates and OIS-implied bias in the CB Rates panel
Cross-Asset Risk Regime
GBP/JPY is highly correlated with global risk appetite because JPY functions as the primary G10 safe-haven and carry-funding currency. The terminal's Cross-Asset Risk Monitor scores the current regime (RISK-ON / MIXED / CAUTION / RISK-OFF) based on VIX, the MOVE Index, gold, SPX, and the yield curve.
The regime directly modulates how to read the COT signals:
- RISK-ON regime: Carry trades are rewarded. GBP/JPY tends to trend in the direction of the COT bias without sharp reversals. Net short JPY positions historically persist and extend in this regime.
- MIXED regime: Signals are contradictory. COT direction is less reliable. Range-bound behavior without a strong catalyst is the historical pattern in this regime.
- CAUTION regime (VIX 18–30): Carry unwind risk is elevated. A sustained CAUTION reading indicates that the probability of a sharp reversal is non-trivial — COT directional signals are historically less reliable in this environment.
- RISK-OFF regime (VIX 30+): JPY strength dominates all other signals. COT data from the prior week loses predictive relevance — the most important variable is the pace of JPY short liquidation. GBP/JPY has historically dropped hundreds of pips in a single session during this regime.
→ See current regime score and VIX in the Cross-Asset Risk Monitor
Retail FX Positioning as a Contrarian Signal
The terminal's Retail FX Positioning panel shows the current long/short ratio and average entry price for GBP/JPY from Myfxbook community data. Retail positioning in GBP/JPY tends to be a reliable contrarian indicator at extremes, for a structural reason: retail traders systematically fade strong trends, accumulating losing positions against institutional momentum.
The useful signal thresholds for GBP/JPY:
| Retail long% | Interpretation | Contrarian implication |
|---|---|---|
| Above 70% long | Retail heavily long, accumulated into a rally | Historically precedes pullbacks or reversals; aligns with institutional short GBP/JPY if confirmed by COT |
| 40–60% long | Neutral — no strong crowd bias | Retail signal is not informative; COT and rate differential carry more weight |
| Below 30% long | Retail heavily short, accumulated into a decline | Historically precedes recoveries; aligns with institutional long GBP/JPY if confirmed by COT |
Average entry price is a secondary signal: if retail is net long with an average entry significantly above the current price, those positions are in loss — increasing the probability of a stop-loss cascade on the downside. If retail is net long with an average entry below current price, those positions are in profit and more likely to be closed into strength rather than force a panic flush.
→ See current GBP/JPY retail long/short ratio in the Retail FX Positioning panel
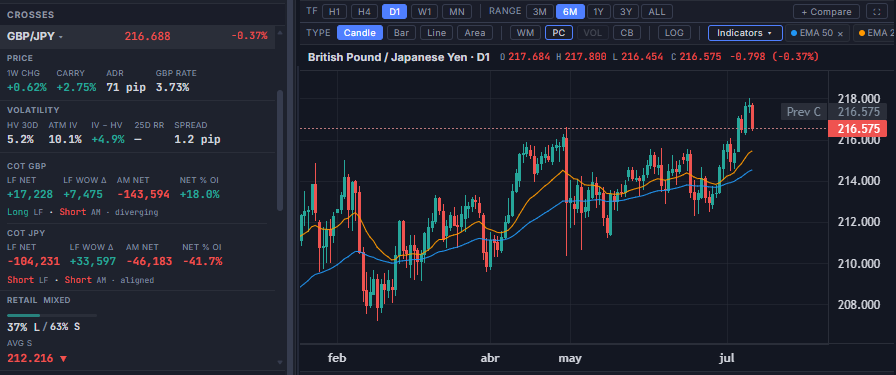
Seeing It Together in the Terminal
The screenshot below is a single Crosses + Pair Detail view for GBP/JPY, cropped from the live terminal. It shows most of the factors this guide covers side by side — GBP and JPY COT positioning, the carry and rate differential, volatility, and the retail long/short split — next to the D1 price chart for the same pair.
Multi-Factor Framework
Cross-referencing all five factors produces a more reliable directional read than any single signal in isolation. The table below maps each factor's bullish and bearish signal and its source in the terminal:
| Factor | Bullish signal | Bearish signal | Where to find it |
|---|---|---|---|
| GBP COT | Net long GBP, rising WoW Δ, green LF/AM dot | Net short GBP, falling WoW Δ, split or red dot | CFTC Positioning panel → GBP row |
| JPY COT | Net short JPY (negative net contracts) | Net long JPY (positive net contracts), especially if rising | CFTC Positioning panel → JPY row |
| Rate differential | BoE Hold/Hike + BoJ Hold/Cut; stable or widening spread | BoJ Hike expected; BoE cutting while BoJ holds | CB Rates panel + CB Rate Expectations panel |
| Risk regime | RISK-ON; VIX below 18; SPX positive; gold flat | CAUTION or RISK-OFF; VIX above 25; gold surging | Cross-Asset Risk Monitor (regime badge + score) |
| Retail sentiment | Retail heavily short GBP/JPY (<30% long) | Retail heavily long GBP/JPY (>70% long) | Retail FX Positioning panel → GBP/JPY row |
What Changes GBP/JPY Bias
The bias established by the framework above can be disrupted by specific, identifiable catalysts. These are the events most likely to force a rapid reassessment:
- BoJ rate decision or unexpected hawkish communication. Any BoJ signal of a sooner-than-expected rate hike compresses the differential and triggers rapid JPY short liquidation. The OIS-implied bias in the CB Rate Expectations panel often prices this in before the meeting — watch for a shift from Hold to Hike in the BoJ row.
- UK CPI or employment data surprise. A significantly below-forecast CPI print increases BoE cut expectations, weakening GBP and reducing the carry spread. A strong employment or wage print does the opposite. The economic calendar in the macro panel flags the next BoE-relevant releases.
- VIX spike above 25. A sudden VIX move above 25 — driven by any macro shock — mechanically triggers JPY short covering regardless of the structural bias. This is the regime-override scenario. The Risk Monitor badge will shift from RISK-ON or MIXED to CAUTION.
- COT WoW Δ reversal at an extreme. If the net GBP position is at a multi-year extreme and the WoW Δ turns negative (institutions starting to reduce longs), this is an early warning of positioning reversal. Similarly for JPY — if net shorts are extreme and WoW Δ turns positive, JPY short covering is beginning. Check the COT detail modal in the terminal (click any COT row) for the 52-week history.
- Tokyo CPI print. A higher-than-expected Tokyo CPI (the leading indicator for national Japan CPI) increases the probability of a BoJ hike, pushing JPY stronger. This is released at the end of the month (typically the last Friday) and frequently moves GBP/JPY sharply during the Tokyo session.
GBP/JPY in the Asian Session
GBP/JPY during the Asian session (Tokyo open, approximately 00:00–09:00 UTC) has distinct behavioral characteristics worth understanding before reading any intraday range data from the terminal's liquidity panel.
The Tokyo session is the home session for JPY. It is the period when BoJ-related news, Japanese economic data, and Tokyo institutional order flow are most active. GBP, on the other hand, has no institutional flow in the Asian session — London desks are offline.
This creates an asymmetric dynamic during Tokyo hours:
- GBP/JPY is effectively trading as a proxy for USD/JPY plus a GBP/USD carry that is not actively managed. Large moves in the Asian session are almost always JPY-driven — either from BoJ news, Japanese CPI/trade data, or risk-off JPY buying.
- The high-low range established during Tokyo (approximately 00:00–09:00 UTC) is typically narrower than London or New York, unless a specific Japan catalyst is present. The terminal's session liquidity panel shows the current session's high-low range for GBP/JPY among other pairs.
- London open (08:00 UTC) is the reactivation point for GBP institutional flow. Large GBP/JPY moves that begin at London open are more likely to be directionally sustained than moves that begin in Tokyo, because they involve active GBP order flow rather than passive JPY moves.
Current GBP and JPY COT positioning, BoE and BoJ rate expectations, cross-asset risk regime, and retail sentiment — all updated continuously throughout the trading week. Available on the web terminal and natively inside MetaTrader 5 through the companion Expert Advisor — both unlock under a single EA rental on MQL5 Market.